Don't buy blindly – see if the price is rising or falling
Is the product price rising or falling? Check the 60-day price history and buy at the best moment
Online shopping can be frustrating. Today you see a "promotion," tomorrow the price is even lower. Or vice versa – you hesitate, and the product becomes more expensive. Without access to data, it's hard to judge if the deal you're seeing is truly a good one. That's why the AuctionMate extension features a function that shows whether a product's price is rising or falling, and displays a 60-day price change chart with a single click. It's a simple tool that lets you make purchasing decisions based on facts, not marketing slogans.
Why check price history before buying?
Prices in online stores and on auction platforms change dynamically. This is influenced by seasonality, product availability, competitor actions, or promotional campaigns.
Without access to product price history, you don't know if:
- the current price is truly the lowest,
- it's a temporary hike,
- the price is steadily falling and it's worth waiting,
- the seller recently raised the price to make a promotion look more attractive.
The price change monitoring feature lets you immediately see the trend direction. At a glance, you know if the price is:
- systematically rising,
- staying stable,
- clearly falling.
This is the first hint that helps you make a sensible purchasing decision.
How does the price trend feature work?
The mechanism is intuitive and requires no configuration.
When you visit a product page or listing, you'll see information on whether the price is rising or falling. This quick signal immediately provides context for the current offer.
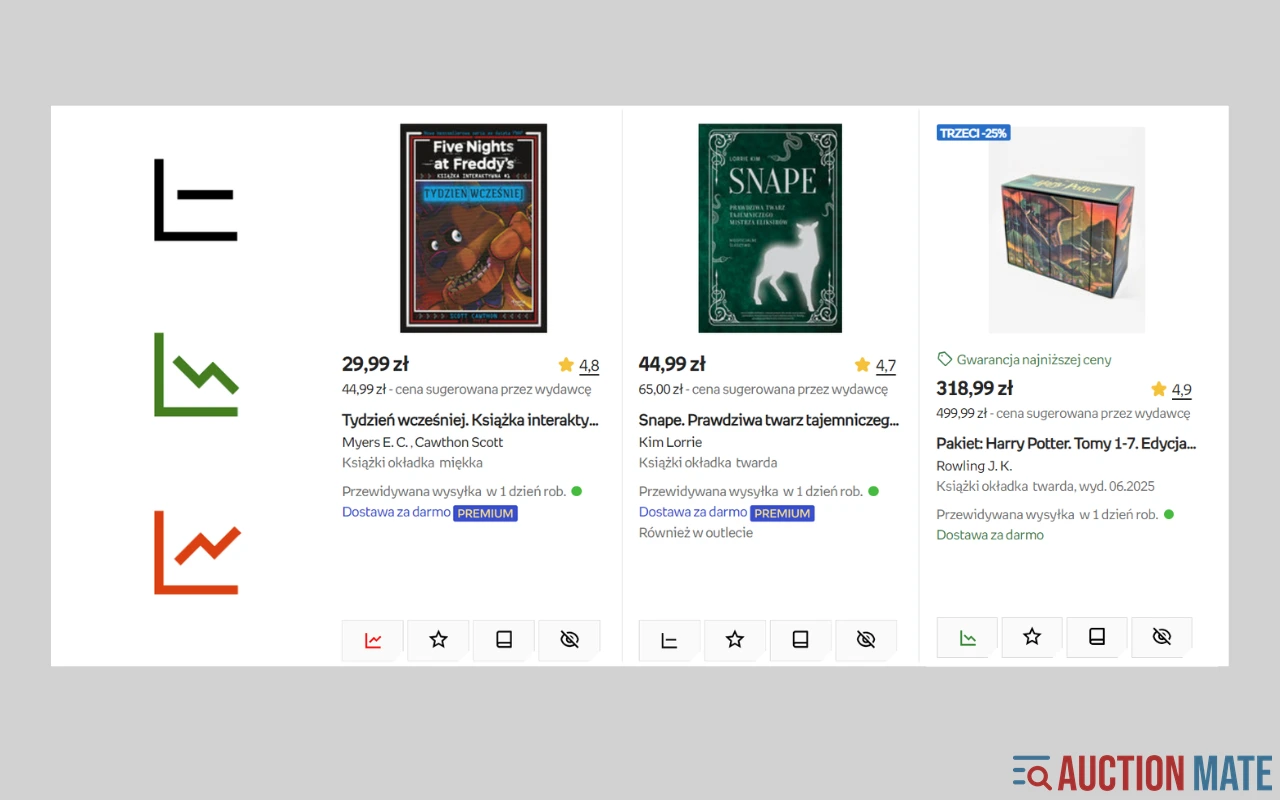
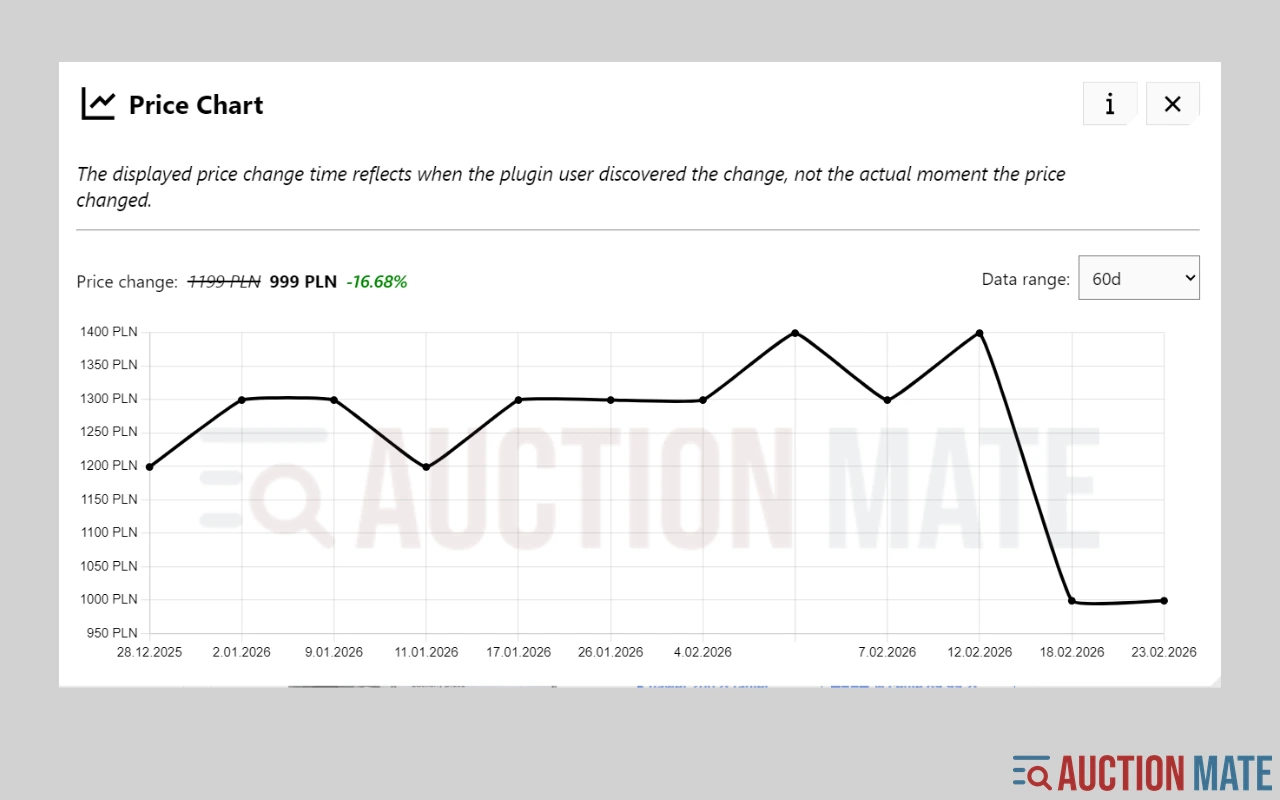
Clicking the icon reveals a chart of price changes over the last 60 days. On the chart, you'll see:
- price levels on specific days,
- moments of sudden drops or hikes,
- the overall price tendency.
This way, you're not analyzing a single number, but the entire history. And that makes a huge difference.
How to use the price chart step-by-step?
It's very simple.
Step 1: Go to the page of the product you're interested in.
Step 2: Check the current price trend info.
Step 3: Click the icon to open the chart.
Step 4: Analyze where the current price stands relative to the last 60 days.
Note if the current price is:
- near the two-month high,
- in the middle of the range,
- at one of the lowest points.
If the price is at a recent low, there's a good chance it's a great time to buy. If it's significantly higher than a few weeks ago, you might consider waiting.
When is price trend analysis most useful?
The online price tracking feature is useful in many scenarios.
When buying electronics, it helps avoid overpaying just before a planned drop. For appliances, it helps judge if a promotion is real. For seasonal products, it allows observing natural price cycles.
It's especially useful during major sales. During events like Black Friday, many offers are labeled "lowest price." With the price history chart, you can quickly verify if it's actually cheaper than before.
This tool provides an information advantage that regular buyers previously lacked.
Buy consciously with price trend analysis
The greatest value of this feature is context. Price alone doesn't tell the whole story. Only the 60-day price history shows if a deal is truly beneficial.
Instead of acting on emotion or time pressure, you can base your decision on data. This means:
- better control over spending,
- lower risk of overpaying,
- more conscious online shopping.
If you want to know if a product price is falling or rising before you click "Buy Now," the price trend analysis in AuctionMate will become one of your most important online shopping tools.