Is It Worth Waiting for a Property Price Drop?

Waiting for a property price drop rarely works — but when it does, the payoff is unusually large. Across 60 days of listing data from the Otodom and Adresowo property portals, only 14% of listings with at least three recorded prices had a lower last price than first price in that window. In that group, however, the average asking-price reduction was PLN 41,849 — more than most buyers manage to negotiate face to face.
Below is what the data says about how often property prices actually fall, how long it takes, and how much money is genuinely on the table. The figures cover the full market on both sites — flats, houses, plots and rentals together, with no category split.
How we analysed the data
The analysis covers 63,978 unique property listings (55,974 from Otodom and 8,004 from Adresowo) and 87,414 price checks performed by AuctionMate users between 7 July and 5 September 2026, observation window: the last 60 days.
It is worth being explicit about the limits of this dataset:
- Without category or location breakdown — flats for sale, rentals, houses and plots are counted together. The figures describe all traffic on Otodom and Adresowo, not a specific segment in a specific city.
- It is not a full market scan. A price is recorded when a real person opens a listing with the extension installed. So this is a slice of the market, but a slice made up of listings that someone genuinely considered.
- We only include listings with at least three recorded prices on the chart (4,638 listings in this analysis), because that is the minimum needed to see a price change over time.
For price comparisons we use listings priced between PLN 100,000 and PLN 5,000,000 to filter out per-square-metre figures and obvious listing errors.
How often do property prices actually fall?
Real estate is by far the most rigid market we track. Among listings checked at least three times:
| What happened to the price | Share of listings |
|---|---|
| Last price lower than first (within 60 days) | 14.1% |
| Fell by at least 5% at some point | 6.4% |
| Fell by at least 10% at some point | 2.2% |
For comparison, 44.8% of tracked car listings on Otomoto were cheaper at the end of the window than at the start, as were 21.6% on Allegro. Someone selling a property revises the price far less often than someone selling a car — partly because there is no depreciation clock ticking, and partly because the asking price was set with negotiating room baked in from day one.
The practical takeaway: waiting should not be your primary strategy. It should be a free hedge in case the seller changes their mind.
When do sellers cut the price? Usually after two to four weeks
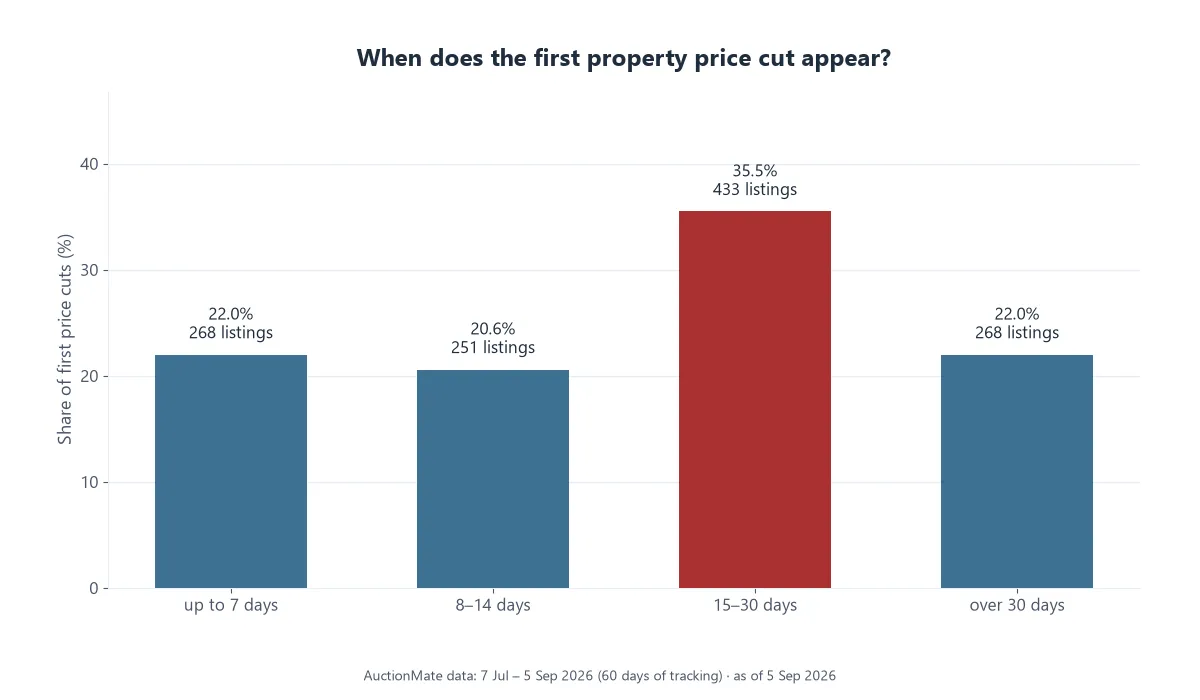
Across the 1,220 listings where we recorded a first genuine reduction (at least 1%), the timing pattern is clear. The first correction arrives after an average of 19.8 days.
| When the first cut lands | Listings | Share |
|---|---|---|
| Up to 7 days | 268 | 22.0% |
| 8–14 days | 251 | 20.6% |
| 15–30 days | 433 | 35.5% |
| Over 30 days | 268 | 22.0% |
More than a third of first reductions land in the 15–30 day window after someone starts watching a listing. During the first week the seller is still testing the market: counting enquiries, watching view numbers, and almost always holding the price.
That suggests a simple plan:
- Week 1 — gather information. Do not make aggressive offers; the price is unlikely to move.
- Weeks 2–3 — set a price alert and watch comparable listings in the same area.
- Week 4 — if the chart shows downward movement, this is your moment. You now have evidence that the seller is flexible.
Exception: an attractive listing in a strong location can sell much earlier — before the price ever drops. This plan reflects the typical timing of corrections in the data, not rare “must-buy” homes where waiting until week 4 means losing the opportunity.
How deep do asking-price cuts go?
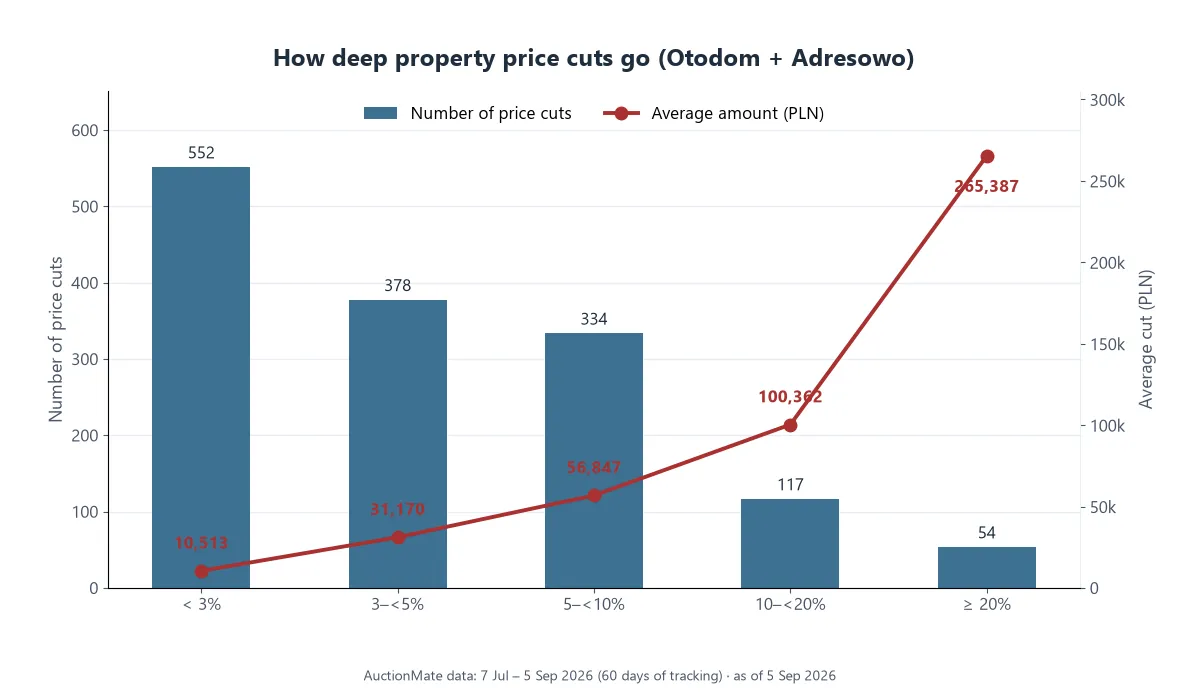
This is where the numbers get interesting. Property price cuts are rare, but their scale is disproportionately large compared with other markets. The table below counts every recorded reduction (1,435 events) — one listing can cut more than once, so this is not the same population as the 1,220 listings with a first cut of ≥1%. The amounts are differences in asking price between consecutive checks, not guaranteed buyer savings.
| Size of reduction | Events | Average amount |
|---|---|---|
| < 3% | 552 | PLN 10,513 |
| 3–<5% | 378 | PLN 31,170 |
| 5–<10% | 334 | PLN 56,847 |
| 10–<20% | 117 | PLN 100,362 |
| ≥ 20% | 54 | PLN 265,387 |
The single deepest correction in our observation window was PLN 1,500,000. Cuts of ≥20% occurred just 54 times across thousands of tracked listings — but each one meant roughly a quarter of a million złoty difference in asking price.
Even a modest 3–<5% reduction averages over PLN 31,000. At those amounts, setting a three-week alert has a completely different cost-benefit profile than it does when buying electronics.
Otodom or Adresowo — where do prices move more?
Both portals serve the same market, yet they behave differently.
| Otodom | Adresowo | |
|---|---|---|
| Unique listings analysed | 55,974 | 8,004 |
| Listings checked more than once | 21.3% | 32.2% |
| Tracked listings with last price lower than first | 15.3% | 9.8% |
| Price changes that were reductions | 7.7% | 4.5% |
| Average reduction | PLN 44,596 | PLN 37,845 |
Adresowo has the highest repeat-visit rate of all 23 platforms in our dataset — almost one in three listings gets checked again. Buyers clearly deliberate longer there. At the same time there are fewer genuine reductions, so extended watching pays off less often.
Otodom, with far greater liquidity, produces more price movement and larger average corrections. If you are searching both, an alert on Otodom will statistically fire more often.
Do expensive properties get discounted more often?
No — and this is one of the more counter-intuitive findings. We split Otodom listings by asking price:
| Asking price | Last < first | Average asking-price difference |
|---|---|---|
| Up to PLN 400,000 | 17.6% | PLN 15,869 |
| PLN 400,000–700,000 | 18.5% | PLN 26,913 |
| Over PLN 700,000 | 11.7% | PLN 91,545 |
The most expensive segment cuts prices least often, but when it does, the amount is several times larger. Above PLN 700,000, a single reduction averages over PLN 91,000 — six times the average cut in the cheapest band.
Cheaper listings move more often because their owners usually face more pressure to sell quickly. The premium segment can wait months for the right buyer without touching the price.
One caveat: price bands are not the same as property type. The top band mixes houses, large flats and plots — the data does not let us separate them.
Watch out for increases before the "concession"
One statistic worth remembering at the negotiating table: on Otodom, reductions account for only 7.7% of all recorded price changes — but when a price moves up, it moves up by an average of 17.8%.
Some owners and agencies raise the asking price before negotiations begin so that the later "concession" looks more generous. Without price history you cannot detect this: you see a single figure and a claim that the seller has already come down. We cover the same mechanism in more detail in discount or manipulation.
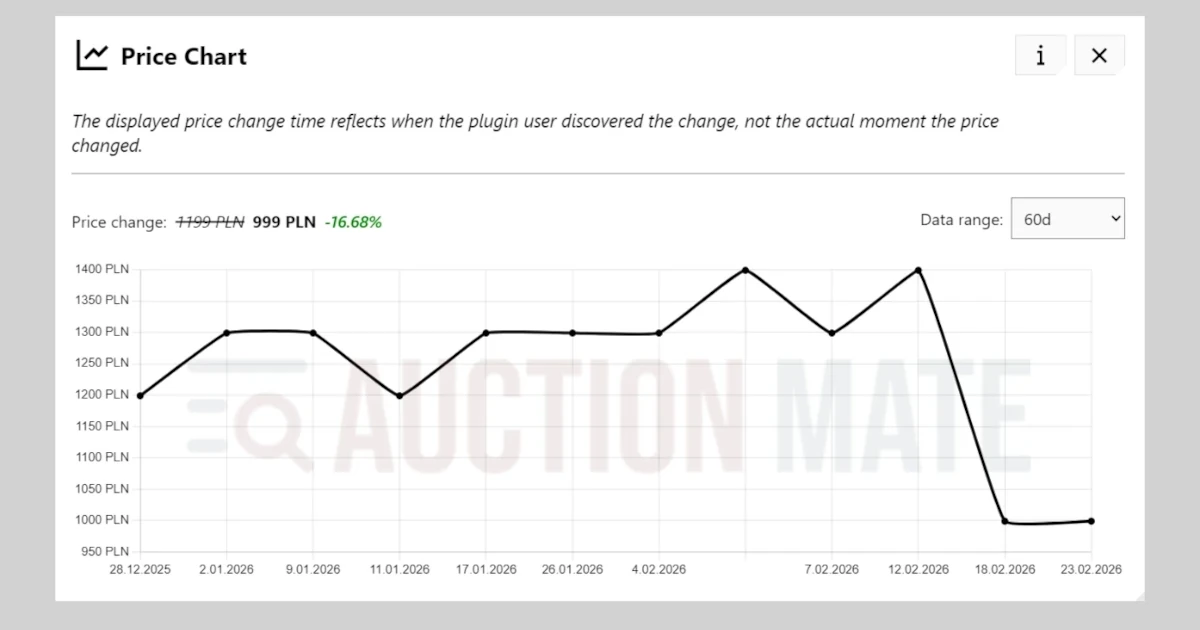
A 60-day chart shows whether today's price is a real correction or a return to last month's level.
How to track a property price without checking daily
Given that the first reduction takes about 20 days on average, revisiting the same listings every day is wasted effort. Passive observation works better.
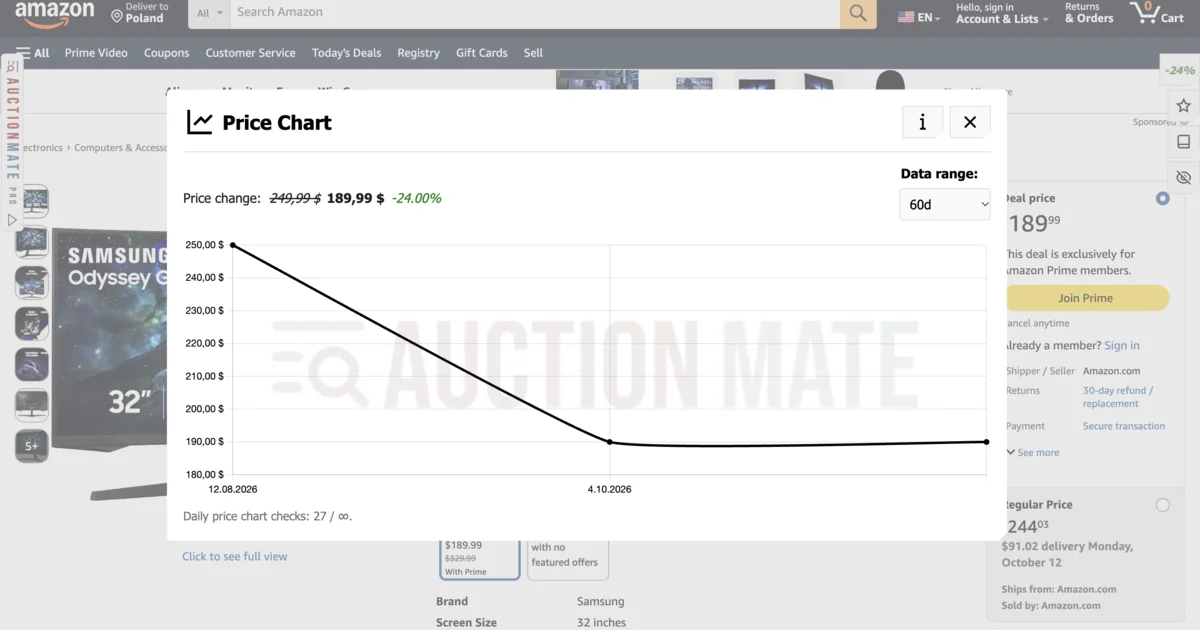
AuctionMate adds a 60-day price history chart to Otodom and Adresowo listing pages, plus an optional alert when the amount changes. You do not need to keep a spreadsheet or remember what a listing cost three weeks ago.

Practical tips specific to property:
- Track several listings in the same area at once — a reduction from a competing seller often forces your seller to follow.
- Set your time horizon up front: "if nothing changes in 30 days, I negotiate at the current price or walk away."
- Record the asking price from day one. That is your reference point in conversation — not the figure the seller now calls "already reduced".
You can read how the chart itself works in don't buy blindly, and see the full list of covered sites in what platforms AuctionMate supports.
Summary: is waiting worth it when buying property?
It depends on how you define waiting.
It is not worth postponing a purchase decision hoping that one specific listing will get cheaper. Statistically, for 86% of listings with at least three recorded prices the last price in the 60-day window is not lower than the first, and a good property in a desirable location will find a buyer before you make up your mind. That applies to flats, houses and plots alike — in the data they behave as one market.
It is worth monitoring prices in parallel with your search, because the cost of doing so is zero while the potential asking-price difference ranges from PLN 15,000 to over PLN 90,000 depending on the segment (that is not a guaranteed purchase saving). The optimal horizon is three to four weeks, since the 15–30 day window contains the largest share of first reductions.
If you want to see how the same patterns look on faster-moving markets, read our guide on when listing prices actually drop.
Install AuctionMate and set alerts on the properties you are watching — if the seller comes down during the typical 15–30 day window, you will be the first to know.
Related articles
-
Article
Don't buy blindly – see if the price is rising or falling
Don't overpay for online shopping. Check the 60-day price history, see the change chart, and find out if it's truly the lowest price.
-
Article
Discount or manipulation? How stores bypass Omnibus rules.
Are discounts really saving you money? Learn how stores manipulate pricing under Omnibus rules and why coupons and deals can be misleading.

Other articles
-
How to check price history on Kleinanzeigen?
Kleinanzeigen hides full price history. AuctionMate charts listing prices in your browser — negotiate with data, set alerts, avoid overpaying.
-
Vinted deals: how to find them and avoid overpaying
Vinted deals are rarely obvious: compare similar listings, check the listing's price history, set an alert and negotiate on facts — right in your browser.
-
Reseller tools: how to source for resale without overpaying
Listing price history before you offer, price change alerts and order across hundreds of listings a day — reseller tools that run in your browser.
-
Is Black Friday a scam? How to tell if the deal is real
Is Black Friday a scam? Sometimes a real deal, sometimes a return to the old price. AuctionMate shows ~60-day history — check before you buy.